
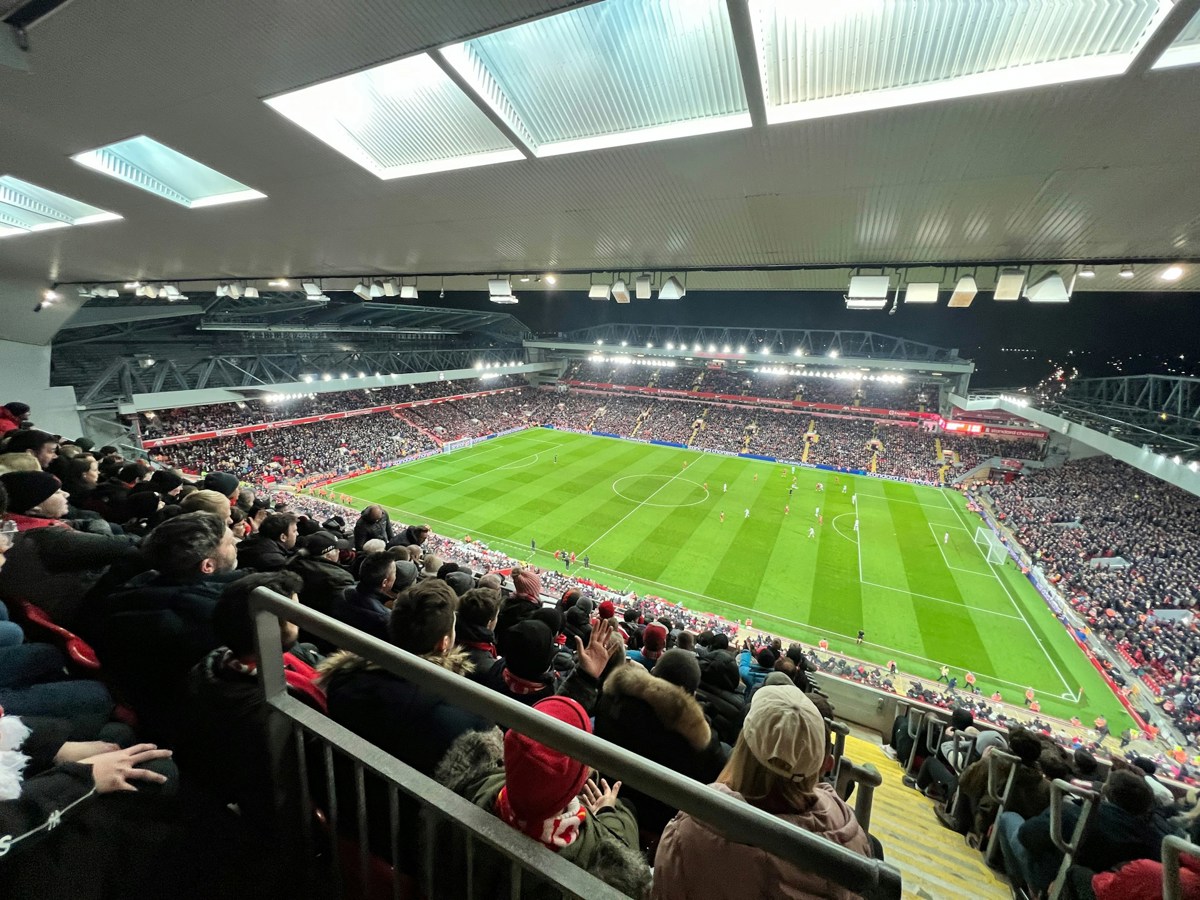
Anfield has produced enough 89th-minute swings that longtime supporters treat a 1-0 scoreline after 85 minutes as unfinished business rather than a result. Steven Gerrard's heroics against Olympiacos in 2004, the three goals inside six second-half minutes against Milan in Istanbul – these are not freak outliers to anyone who has watched Liverpool for a decade. Yet odds compilers keep pricing a goal after the 85th minute as though it belongs in the same bracket as a red card inside the first ninety seconds.
The gap between that pricing and the actual frequency of late strikes is where value hides, and it is exactly the kind of pattern a site built around soccer betting will flag before a market corrects itself. A trader setting the initial line for a match works from a base model, not from the specific fatigue profile of a full-back who has played four games in eleven days, and that gap between a generic assumption and twenty-two specific bodies on a specific night is where most of the mispricing quietly lives.
Pre-match odds are built hours or days out, long before anyone knows which side will be chasing the game or sitting on a lead they want to protect. That forces compilers to lean on averages – roughly 15% of Premier League goals since 2018 have landed after the 75th minute, a figure that sounds small until you notice it covers only 20% of playing time.
The mismatch grows once a match is actually underway. In-play models adjust for scoreline and pressure, but the starting assumption – that goals distribute evenly across ninety minutes – still colours how quickly a price moves after the 80th-minute mark. A team down by one goal with a corner in the 87th minute is treated more cautiously by the market than the situation warrants, partly because correcting the bias fully would mean rebuilding the model around minute-by-minute substitution data for every squad, every week, which costs more than the edge it removes is worth to a compiler pricing hundreds of matches a weekend.
Substitution patterns explain a chunk of the skew. Fresh legs introduced around the 70th minute are directly involved in a disproportionate share of late goals – over a three-season sample tracked across five European leagues, substitutes were involved in 31% of goals scored after minute 80, despite playing roughly 12% of total minutes. A manager sending on a pacey winger in the 72nd minute is, in effect, injecting a variable the pre-match price never accounted for.
Fatigue on the other side compounds it. A mistimed tackle in the 84th minute, a full-back three steps slow on a recovery run – these cluster hard in the closing quarter, and most distribution models never build in a separate line item for exhaustion versus a fresh substitute. Centre-backs covering for a tired teammate tend to make a specific, repeatable error late on, and it shows up often enough across a season to count as pattern, not misfortune.
| Minute band | Share of match time | Share of goals scored |
| 1-15 | 16.7% | 9% |
| 16-45 | 33.3% | 27% |
| 46-75 | 33.3% | 35% |
| 76-90+ | 16.7% | 29% |
Squad depth is the clearest driver. Clubs carrying two genuinely interchangeable options per position tend to keep chance creation stable past the 75th minute, while thinner squads see a measurable drop in shot quality once first-choice players tire. Manager tendencies matter too – some sides are built explicitly to press harder as the game opens up, converting late pressure into a repeatable pattern rather than a coincidence, and a club's late-goal record over a full season tends to say more about its bench and its coaching philosophy than about luck.
The practical opening is narrow but real: prices for "goal in the final 15 minutes" markets are set before live substitution news, injury updates, or in-game fatigue signals are priced in. Watching how a team has used its bench across its last five matches, rather than reading the pre-match team sheet alone, gives a sharper read than the initial line reflects, and cross-checking that against how often the opponent has conceded from set pieces after the 80th minute narrows the picture further still.
None of this turns late goals into a certainty – most matches still end exactly where the 75th-minute scoreline suggested they would. What changes is the size of the gap between what actually happens and what a static, time-averaged model assumes will happen. That gap is small on any single match and consistent enough across a season that it is worth tracking rather than dismissing as noise. Liverpool's own history, full of matches settled in the final ten minutes, is really just a loud, memorable example of a pattern that plays out quietly in far more ordinary fixtures every single week.