Image: Ferrari F40 by Günter Hentschel, licensed under CC BY-ND 2.0
The summer transfer window is now closed so let's take a look at Liverpool's transfer activity for the last 5
seasons using the data from LFChistory.net. FSG purchased Liverpool in October 2010, so this period covers
all the seasons under the control of John Henry and Tom Werner.
This summer's activity has seen purchases of £86M*, sales of £70.4M giving a total net spend of £15.6M. Liverpool's average transfer net spend since the summer of 2011 is £24.7M per season. This average net spend figure is a useful, though limited, measure of the change to the baseline squad per season. Depending on your point of view, you can think of the net spend as some fine-tuning to the red Ferrari or the next set of parts for the kit car.
*This includes an estimated fee of £6M for Danny Ings, with the actual fee still to be agreed by tribunal.
Clear as Mud
Let's compare the average net spend of the top 6 teams for the last 5 seasons using data from
transferleague.co.uk.
Liverpool are 4th with an average net spend per season of £32.5M. Why does this transferleague.co.uk
figure differ from the £24.7M reported by lfchistory.net for the same 5 year period? The main reason is simply
that it is difficult to be certain about transfer spend, for any of the clubs. Sometimes the clubs deliberately
make the actual fee as clear as mud. And sometimes the fee has conditions that result in
different fees being reported.
For example, take Raheem Sterling's transfer to Manchester City. The widely reported fee - as shown on
lfchistory.net - is £49M. Transferleague.co.uk report the fee as £35.2M. That's a difference of £13.8M for a
single transaction, and both are right! Transferleague.co.uk explain that the actual fee is believed to be
£44M with a bonus of £5M payable if City win the Champions League; with 20% of the £44M going to QPR
leaving £35.2M for Liverpool.
Holes in the Net
That's not the only reason that net spend needs to be treated with caution as it fluctuates wildly from one season to the next. The reported
figure depends on the time period that is chosen. In the graph above, the
start point is the summer of 2011 covering FSG's first 5 years. Ten seasons ago
the results would be different and you would see further evidence of the huge investment by
Chelsea and Manchester City as well as Liverpool's negative net spend during the Hicks and Gillette
ownership.
While net spend is a useful measure of the change to the baseline value of the playing squad it doesn't
tell the whole story about player spend. If Raheem Sterling had signed a new contract with
Liverpool then this significant investment would not have shown up in the transfer data. This goes for all
contract extensions, including those for academy players, when the market value of the player is reassessed
by the club.
Correlation and Causation
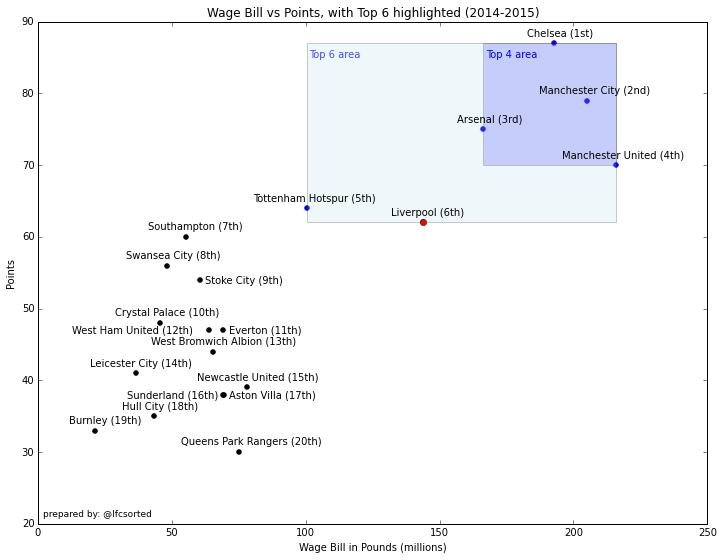
What measure should you use to help determine if a club is ready to challenge for the top 4 places and
the league title? The graph below shows the wage bill for each club plotted against league points for last
season, 2014-2015.
There is a correlation between the clubs with the highest wage bill and the
position they finish in the league. The clubs that have the top 4 wage bills finished in the top 4 league positions. Note that the wage bill doesn't align exactly with league position as Liverpool should have finished above Tottenham and the Manchester clubs above Chelsea. Again the time period is key, other studies have shown that if you analyse the data over a longer period then the correlation between the average wage bill and the average league position is stronger. For example, in
The Numbers Game the authors show that wages explain 81% of the variation in league position, using a decade of data.
The wage bill measure also needs caution. Just because the wage bill shows a correlation to the league
position this doesn't mean that the wage bill causes the league position. You can't pay a mediocre squad
high wages and hope to win the league. There are many other factors at play, for example the balance,
depth and maturity of the squad. If a team is critically dependent on a single player then injury can have a
devastating effect; as Liverpool know from Sturridge's injury last season. The wage bill must have a direct
correlation with player quality if a team is to compete effectively with its rivals.
Deep Pockets and Magic Bullets
So Liverpool just needs to spend more on quality players, right? Unfortunately it is not as simple as that. In a
well run, sustainable club the wage bill is limited by the club's revenue. In the most recent accounts all of
the top 6 clubs have a wage bill between 50% and 60% of their revenue. Liverpool's wage bill is 56% of its
revenue.
Of course many transfers will not work out, and a high transfer fee is no guarantee of success.
Tomkins' Law
says that only about 40% of transfers will be successful. See Paul Tomkins' excellent article on
100 most expensive players, including a summary of his work on 'transfer price index' that underpins the eponymous
'law'.
Only the clubs with the deepest pockets can afford to play 'transfer roulette', particularly when buying the
so called 'proven' players who carry a world-class price tag and usually arrive at an age that sees their resale
value plummet if it doesn't work out.
For example, Manchester United lost over £15M on Di Maria's one
season guest appearance on the way to Paris. The richest clubs can afford to make big mistakes and to
stock-pile quality players in every position to help compete across multiple competitions over a long, injury-ravaged
season. Therefore the richest clubs, those that can afford the highest player and management wage bill, will
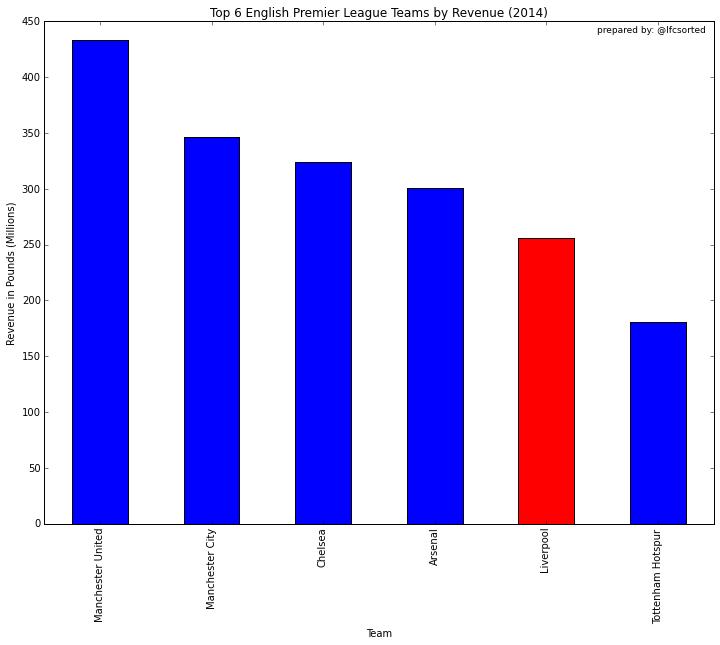
typically finish highest in the league. Let's take a look at the top 6 richest English clubs using data from the
Deloitte Football Money League for 2015.
Liverpool are 9th in the World revenue league and 5th in the English revenue league. The revenue gap from
Liverpool to the top is huge. Manchester United's annual revenue is almost 70% more than that of
Liverpool.
See
Swiss Ramble's excellent 2014-2015 review for a more detailed assessment of Liverpool's finances. FSG
are clearly looking to address the shortfall in match day income with the expansion of Anfield in order to
narrow the gap on our top four rivals. Our hope must be that this investment will eventually enable the club
to spend more on the squad. However, this is not a magic bullet that will deliver a short-term fix to the
wage bill (and quality) gap.
Beating the odds
There are 4 Premier League clubs with more financial muscle than Liverpool. And those clubs finished in the top 4 league positions, with Champions League income helping to sustain the gap to the chasing pack. So should we, the fans, give up on our hope of winning the title any time soon? Well no, I don't agree with that view. It just means that the odds are not in our favour.
Liverpool must find a different, smarter way to compete. Perhaps we've seen signs of the strategy with Brendan Rodger's emphasis on youth. The average age of the team that finished against Arsenal was a very low 24.5 years. The transfer purchases in the summer of 2015 have tried to address the major issue from last season, the lack of goals (with pace and mobility) in the squad.
Liverpool's successful 2013-2014 season proves that Liverpool can beat the odds. There are many reasons why the planets aligned to help Brendan Rodger's valiant team to nearly win the league only two seasons ago. One of the reasons was the courageous, fast-moving, attack-oriented football that unsettled the best of opposition. We haven't seen this approach yet but I'm hoping that it is part of the plan for 2015-2016, particularly when Daniel Sturridge returns. Another reason was the fantastic support, so sing your heart out, inspire and intimidate. Put on your red-tinted shades, strap into the red Ferrari and enjoy the ride.
Copyright - Terry Dolan, @lfcsorted, for LFChistory.net